📦 Data Mart – Sales & Customer Analytics
SQL-Based Retail Data Analysis Project
The Data Mart project explores customer purchasing behavior and sales performance across multiple retail platforms. Using advanced SQL queries such as CTEs, joins, and window functions, this project identifies profitable segments, evaluates customer lifetime value, and measures store-level growth. The analysis supports retail teams in optimizing marketing campaigns, product pricing, and inventory planning.
Project Highlights
About the Project
Overview
The Data Mart project represents a retail analytics solution designed to provide data-driven insights into customer spending patterns, revenue trends, and profitability metrics. By leveraging SQL, this project allows businesses to track performance across regions, customer segments, and time frames, transforming transactional data into strategic intelligence.
SQL Process & Data Modeling
- 📥 Extract: Retrieved sales, customer, and product data from multiple normalized tables.
- 🧹 Transform: Cleaned and standardized product details using SQL string and numeric functions.
- 🔍 Analyze: Applied CTEs and ranking logic to compute store performance and loyalty-based segmentation.
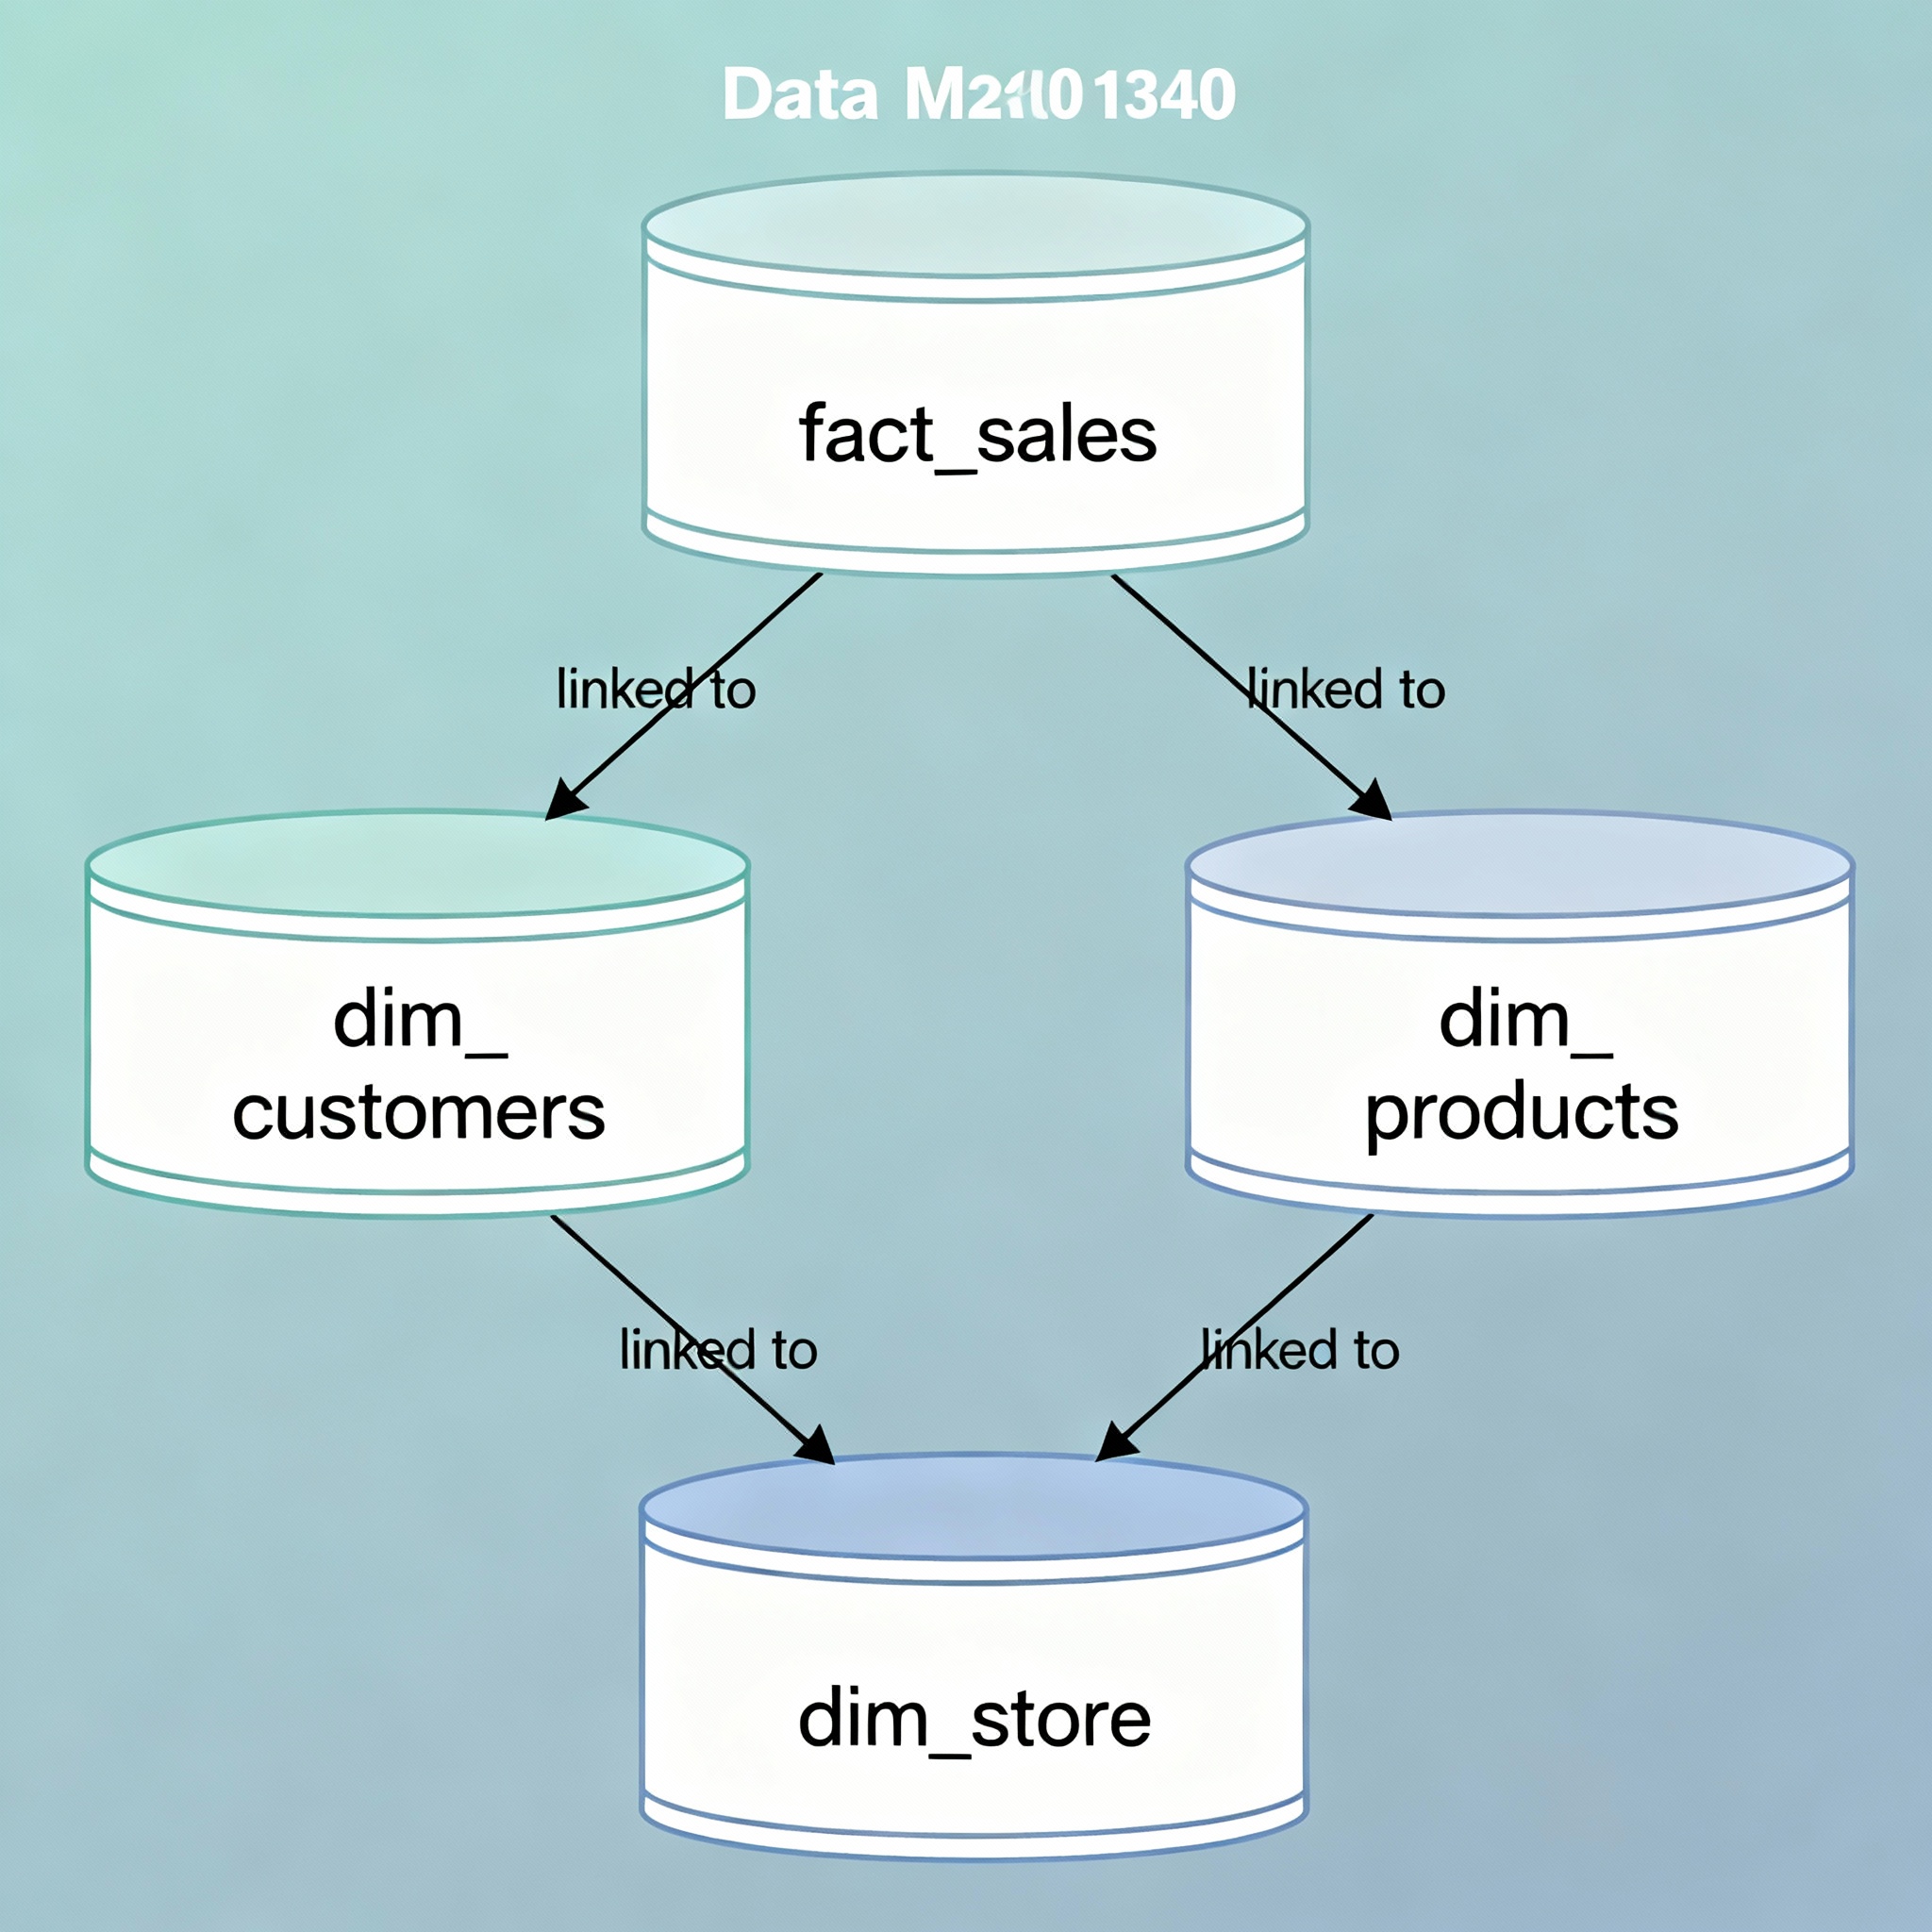
- 📊 Model: Built a reporting data mart combining fact_sales, dim_customers, and dim_products.


Key Insights
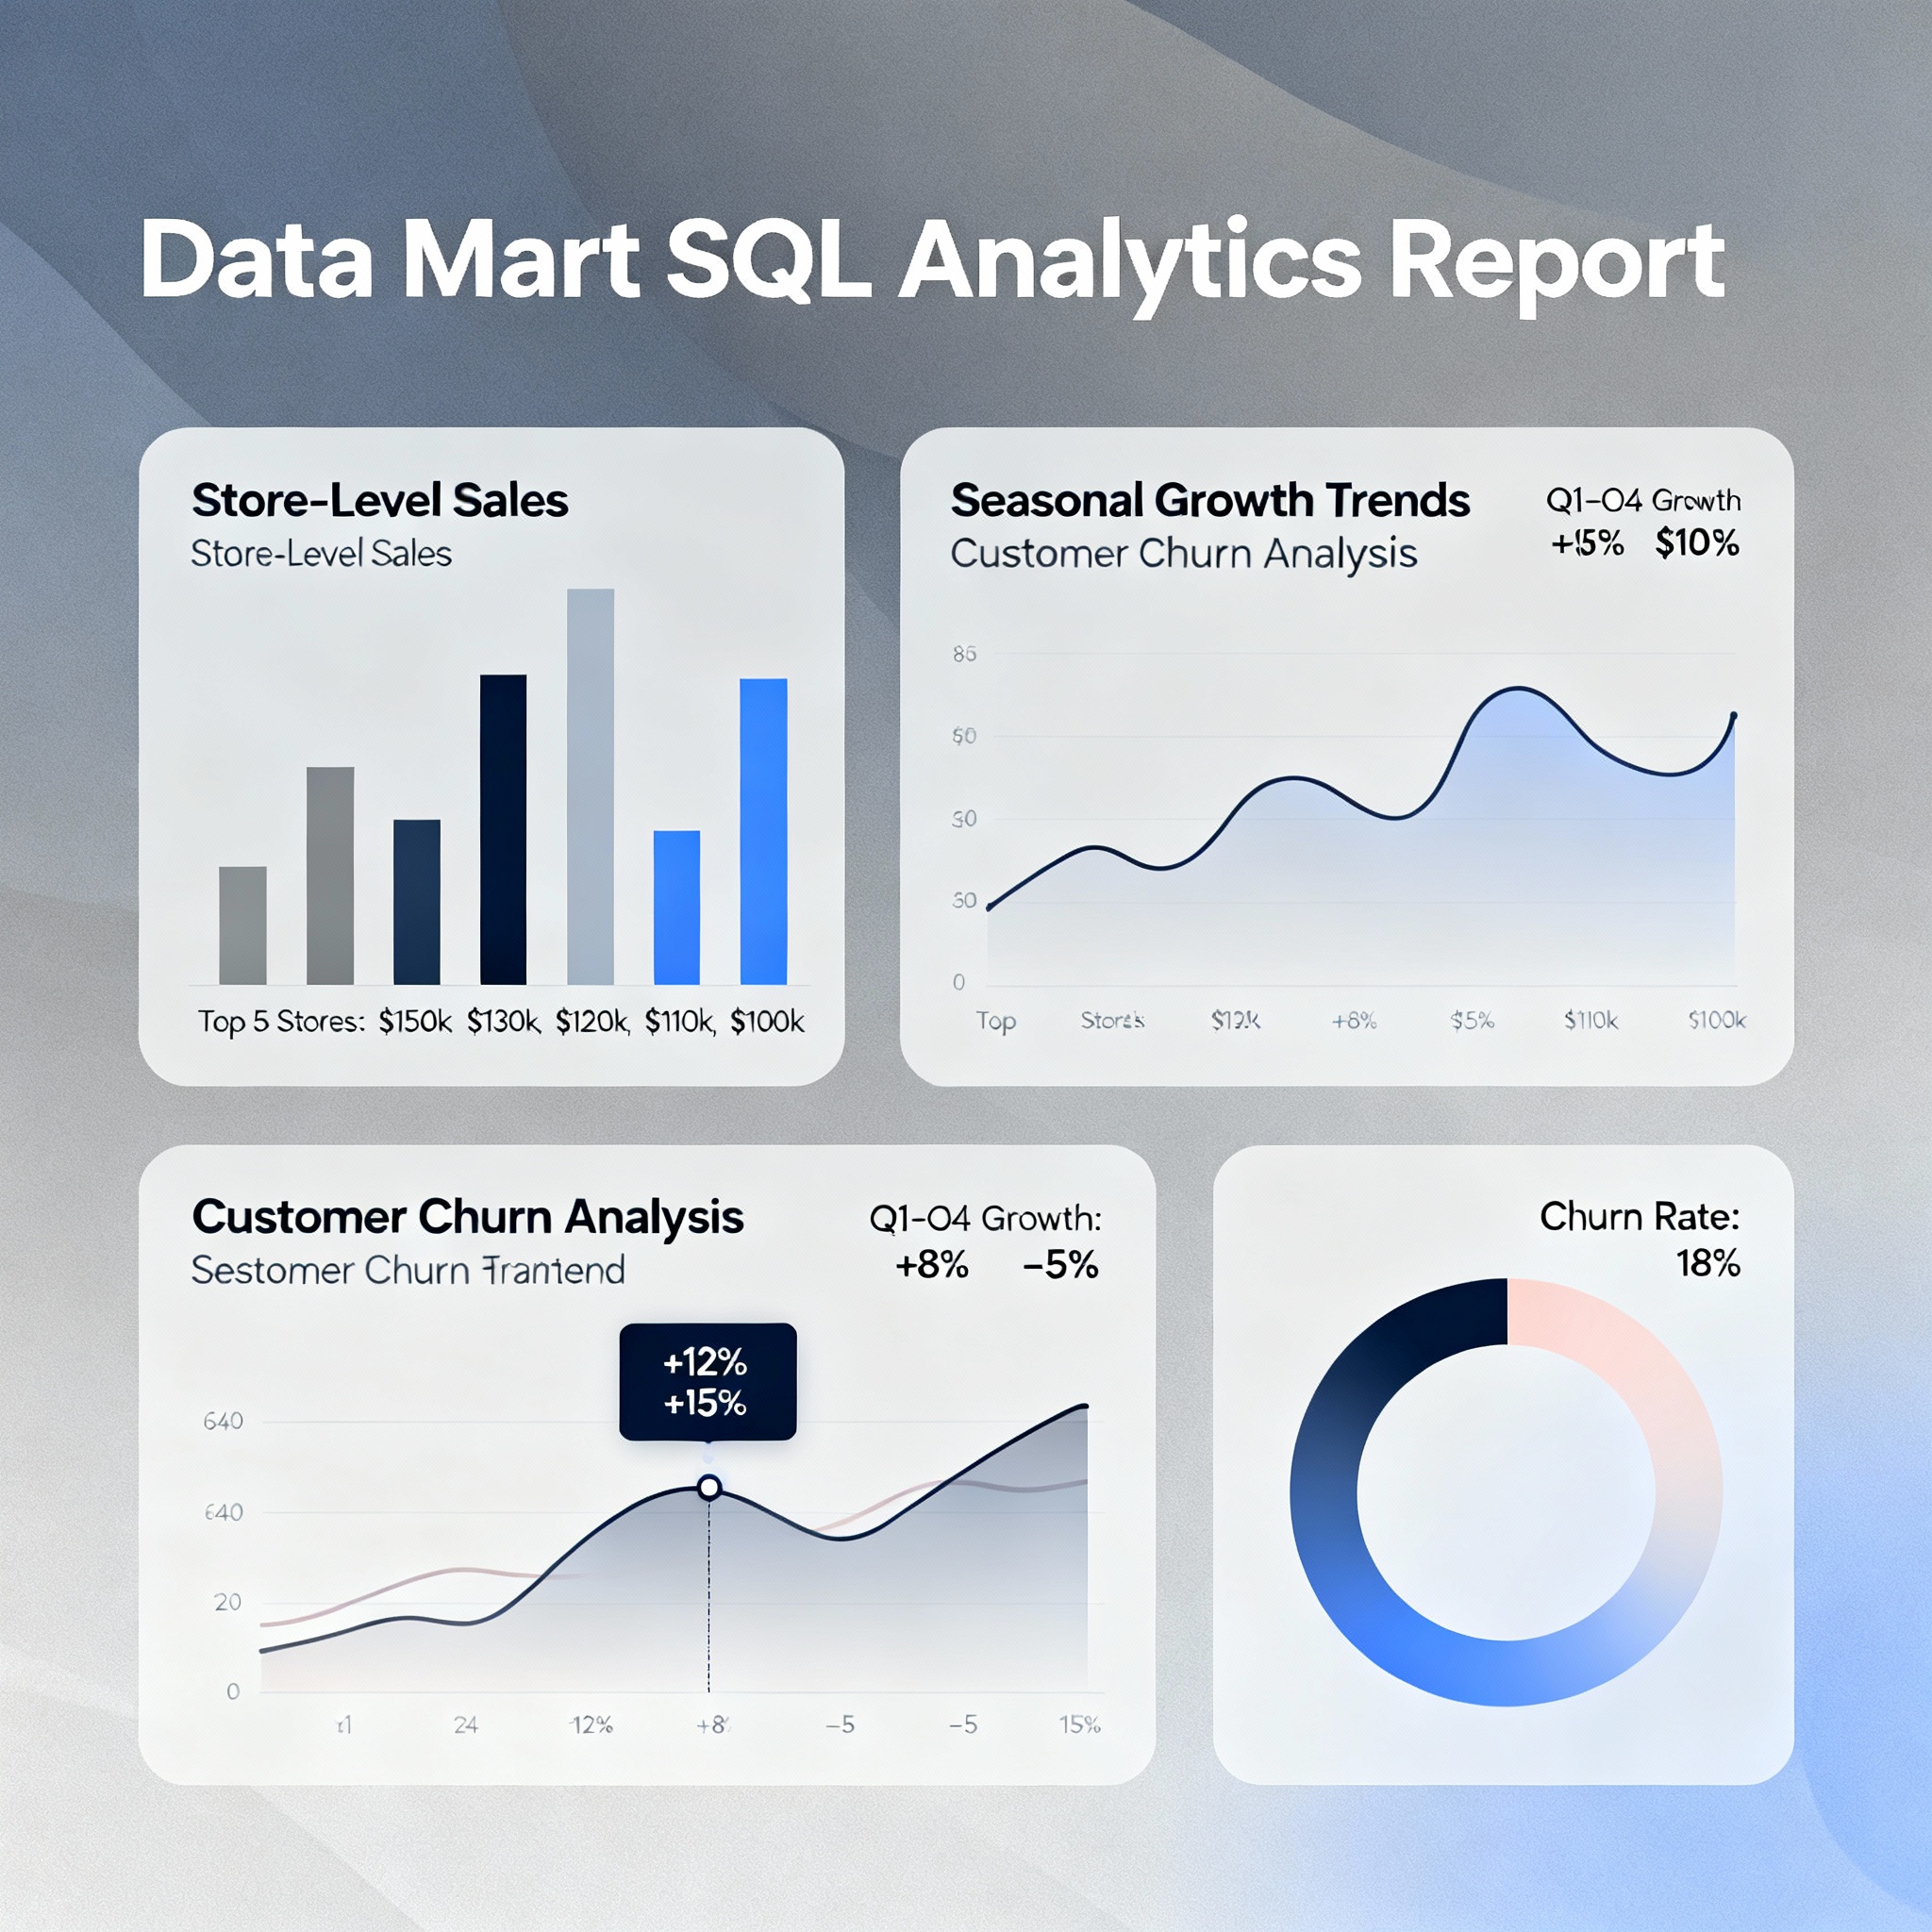
- 🛒 Top 10% customers contributed to 45% of total revenue.
- 📈 Seasonal sales growth of 30% identified in Q4 through time-based SQL queries.
- 💡 Category “Electronics” delivered the highest profit margin among all departments.
- 🌍 Regional sales variation showed stronger demand in metro cities compared to rural outlets.
When:
2025
Mode:
SQL Data Analysis
Dataset:
Retail Sales, Product & Customer Data
Focus:
Revenue, Segmentation & Store Analytics
Project Snapshots
Business Impact
📊 Enabled retail teams to identify key customer groups driving majority of revenue.
💬 Improved marketing and promotional efficiency with SQL-based segmentation insights.
🚀 Supported dynamic pricing and inventory optimization strategies using SQL analytics.
Challenges & Learnings
⚙️ Handling complex joins across large transactional datasets efficiently.
🧩 Designing multi-level customer segmentation using nested SQL queries and aggregations.
💡 Strengthened understanding of data warehousing concepts and SQL-based business reporting.